Quality control
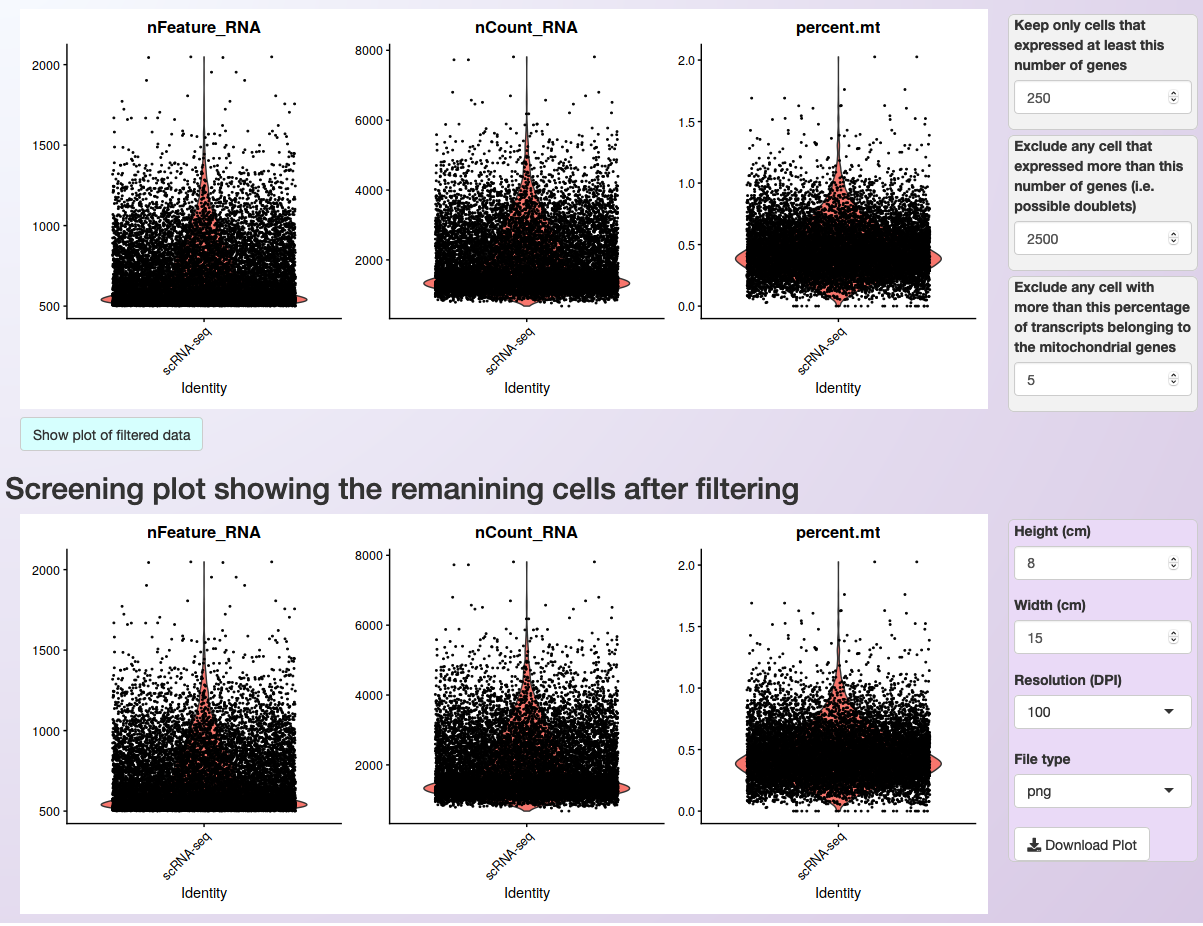
After integrating the datasets, a violin plot will be generated showing the distribution of cells according to three parameters:
nFeature_RNA: the number of genes detected in each cell
nCount_RNA: the number of molecules detected per cell
percent.mt: the percentage of transcripts that map to mitochondrial genes
After visualizing the distribution of cells, it is possible to set more restrictive parameters (on the right side of the plot) and filter cells based on the number of expressed genes per cell and the percentage of transcripts from mitochondrial genes. By clicking on Show plot of filtered data, users can see the distribution of cells after filtering and then readjust the parameters. The figure below shows the distribution of cells of the PBMC integrated (containing the Control and Treatment datasets, see Loading the data and integration of multiple samples) dataset before and after filtering.

Asc-Seurat allows users to download each of the plots with high-resolution by clicking on the Download plot button.