Clustering
After filtering the data to remove low-quality cells, Asc-Seurat v3 normalizes the object, runs PCA, clusters the cells, and builds the embeddings used for downstream interpretation. In the Single Sample workflow these actions are split across two cards:
Step 3: Normalization & PCA prepares the object and creates the PCA elbow plot.
Step 4: Clustering & Visualization runs clustering and displays the UMAP/tSNE summaries.
After clustering, the Single Sample tab also lets you rename
clusters directly from the UI. This is useful for assigning
biological labels, such as T cells or B cells, before moving on
to differential expression and marker visualization.
Step 3: Normalization & PCA
The normalization card supports Seurat’s LogNormalize workflow and SCTransform v2. Choose the method, set the number of variable features, optionally score cell cycle, and click Run Normalization + PCA.
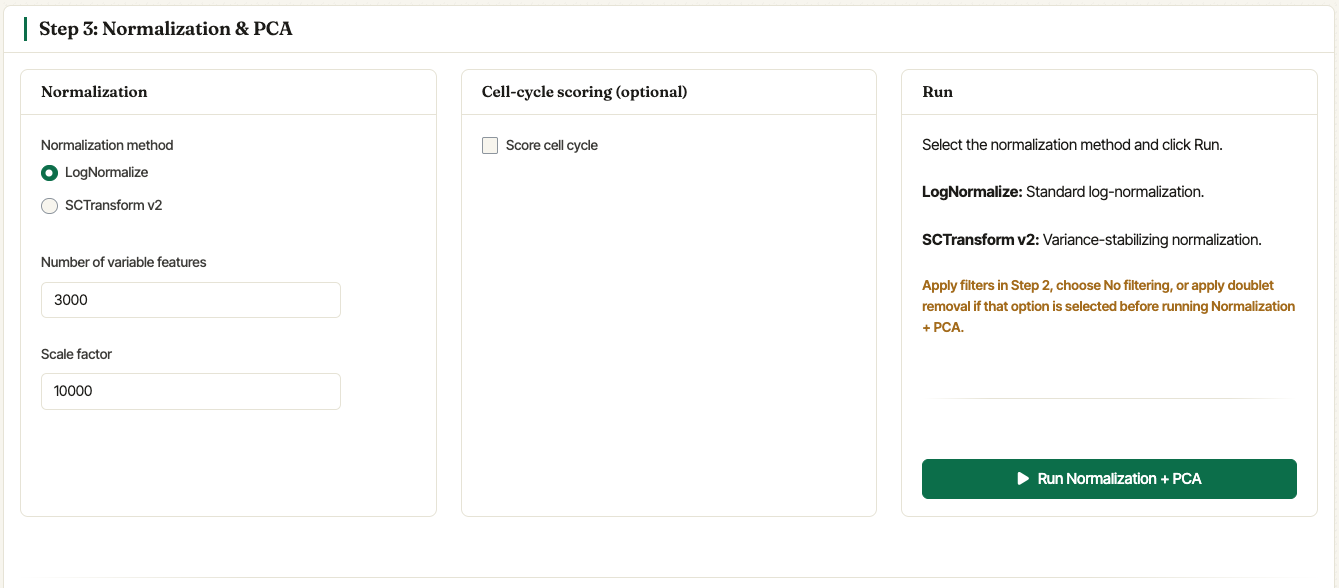
Step 3 combines normalization settings, optional cell-cycle scoring, and the command that runs PCA.
For LogNormalize, the scale factor is shown directly in the
Normalization card. The default 10000 is appropriate for most
single-cell datasets, but it can be changed when needed. Asc-Seurat
then calls Seurat’s
FindVariableFeatures
using the requested number of variable features.
For SCTransform v2, Asc-Seurat runs variance-stabilizing normalization and uses the requested number of variable features. When metadata columns are available, the interface also allows variables to be regressed out. If cell-cycle scoring is enabled, users can score human or mouse cell-cycle genes and optionally regress the scores during scaling.
Note
When SCTransform is selected, Asc-Seurat uses the SCT assay for
PCA and clustering, while also preparing normalized RNA assay
values for downstream differential expression and expression
visualization.
Choosing PCA dimensions
After Run Normalization + PCA completes, Asc-Seurat shows an elbow plot and a PCA Dimensions card in the same Step 3 section. Use the elbow plot to choose how many principal components should be used for clustering. The selected value is carried into Step 4.
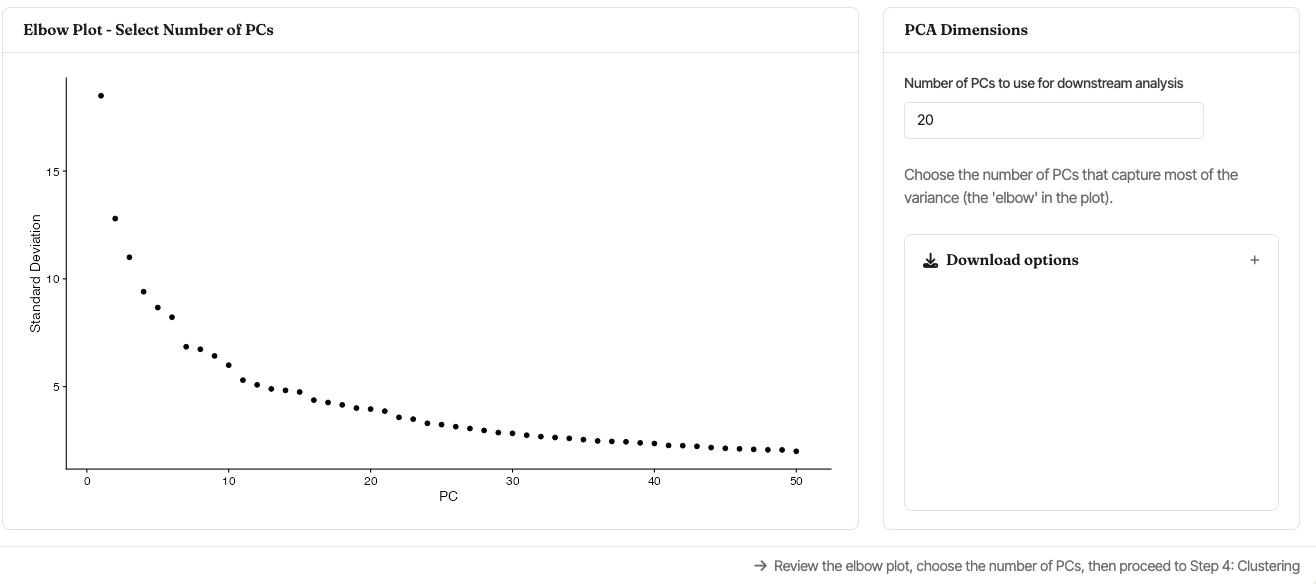
The elbow plot helps identify a reasonable number of PCs for the
clustering step. The demo dataset shown here uses the default value
of 30 PCs.
Step 4: Clustering & Visualization
The clustering card uses the selected PCs from Step 3. Set the Clustering resolution and click Run Clustering. Internally, Asc-Seurat uses Seurat’s FindNeighbors, FindClusters, and dimensionality-reduction plotting functions.
Resolution controls the number of clusters. Larger values generally
split cells into more clusters; smaller values merge them into broader
groups. For datasets of a few thousand cells, values around 0.4 to
1.2 are common starting points, but the best value depends on the
biological question and marker-gene interpretation.
Tip
There is no single optimal resolution. Try a small set of values and evaluate whether known marker genes, expected cell states, and downstream differential expression agree with the resulting cluster structure.
After clustering, the Single Sample workflow displays a UMAP plot and a tSNE plot colored by cluster.
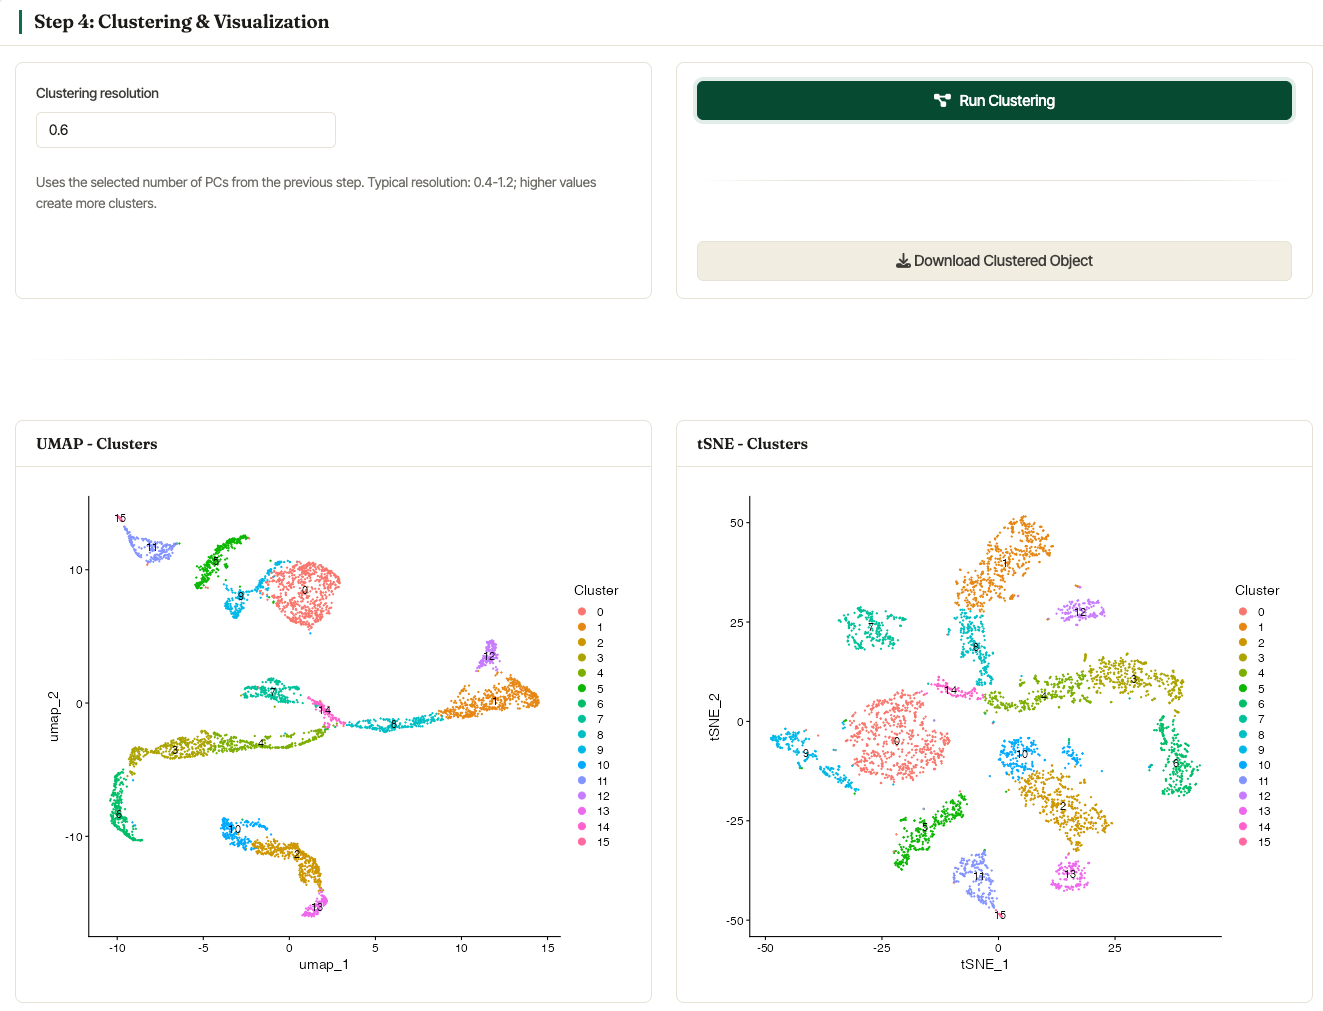
UMAP and tSNE plots generated from the Asc-Seurat v3 demo dataset after normalization and clustering.
Asc-Seurat also reports the number of cells assigned to each cluster. The clustered object can be downloaded from the same section, and plot download controls are available for exported figures.
Renaming clusters
Once clustering has completed, expand Rename clusters (optional) to replace numeric cluster IDs with biological labels. Click Apply New Names to update the cluster identities stored in the active object.
Selecting clusters of interest
The Cluster Selection / Exclusion (optional) card can be used to keep or remove specific clusters before continuing with downstream analysis. Enable Reanalyze subset?, choose whether to Select or Exclude clusters, and click Reanalyze Subset.
When Recompute PCA and clusters is selected, Asc-Seurat creates a new subset object, recomputes normalization and PCA, and shows an updated elbow plot. Review the new elbow plot, keep or adjust the number of PCs in Step 3, and click Run Clustering again.
When Keep current reduction and clusters is selected, Asc-Seurat keeps the current embeddings and cluster labels for the selected subset. This is useful for quickly carrying a subset forward without rerunning the full clustering workflow.
Warning
Cluster numbering can change after selecting or excluding clusters, especially when PCA and clustering are recomputed for the subset.