Clustering
In the Integration tab, Asc-Seurat v3 separates multi-sample integration from clustering:
Step 1: Multi-Sample Integration loads the samples, runs RPCA or Harmony integration, shows post-integration QC metrics, and displays the PCA elbow plot used to choose clustering dimensions.
Step 2: Clustering & Visualization uses the selected PCs to cluster the integrated object and display sample-aware UMAP summaries.
The integrated clustering workflow also supports cluster renaming and optional cluster selection or exclusion before downstream differential expression and visualization.
Integration QC and PCA dimensions
After Load & Integrate finishes, Asc-Seurat reports the number of cells, features, samples, integration method, and mitochondrial tags used for each sample. The same section displays integration QC violin plots, optional post-integration filtering, and the elbow plot used to choose the number of PCs for clustering.
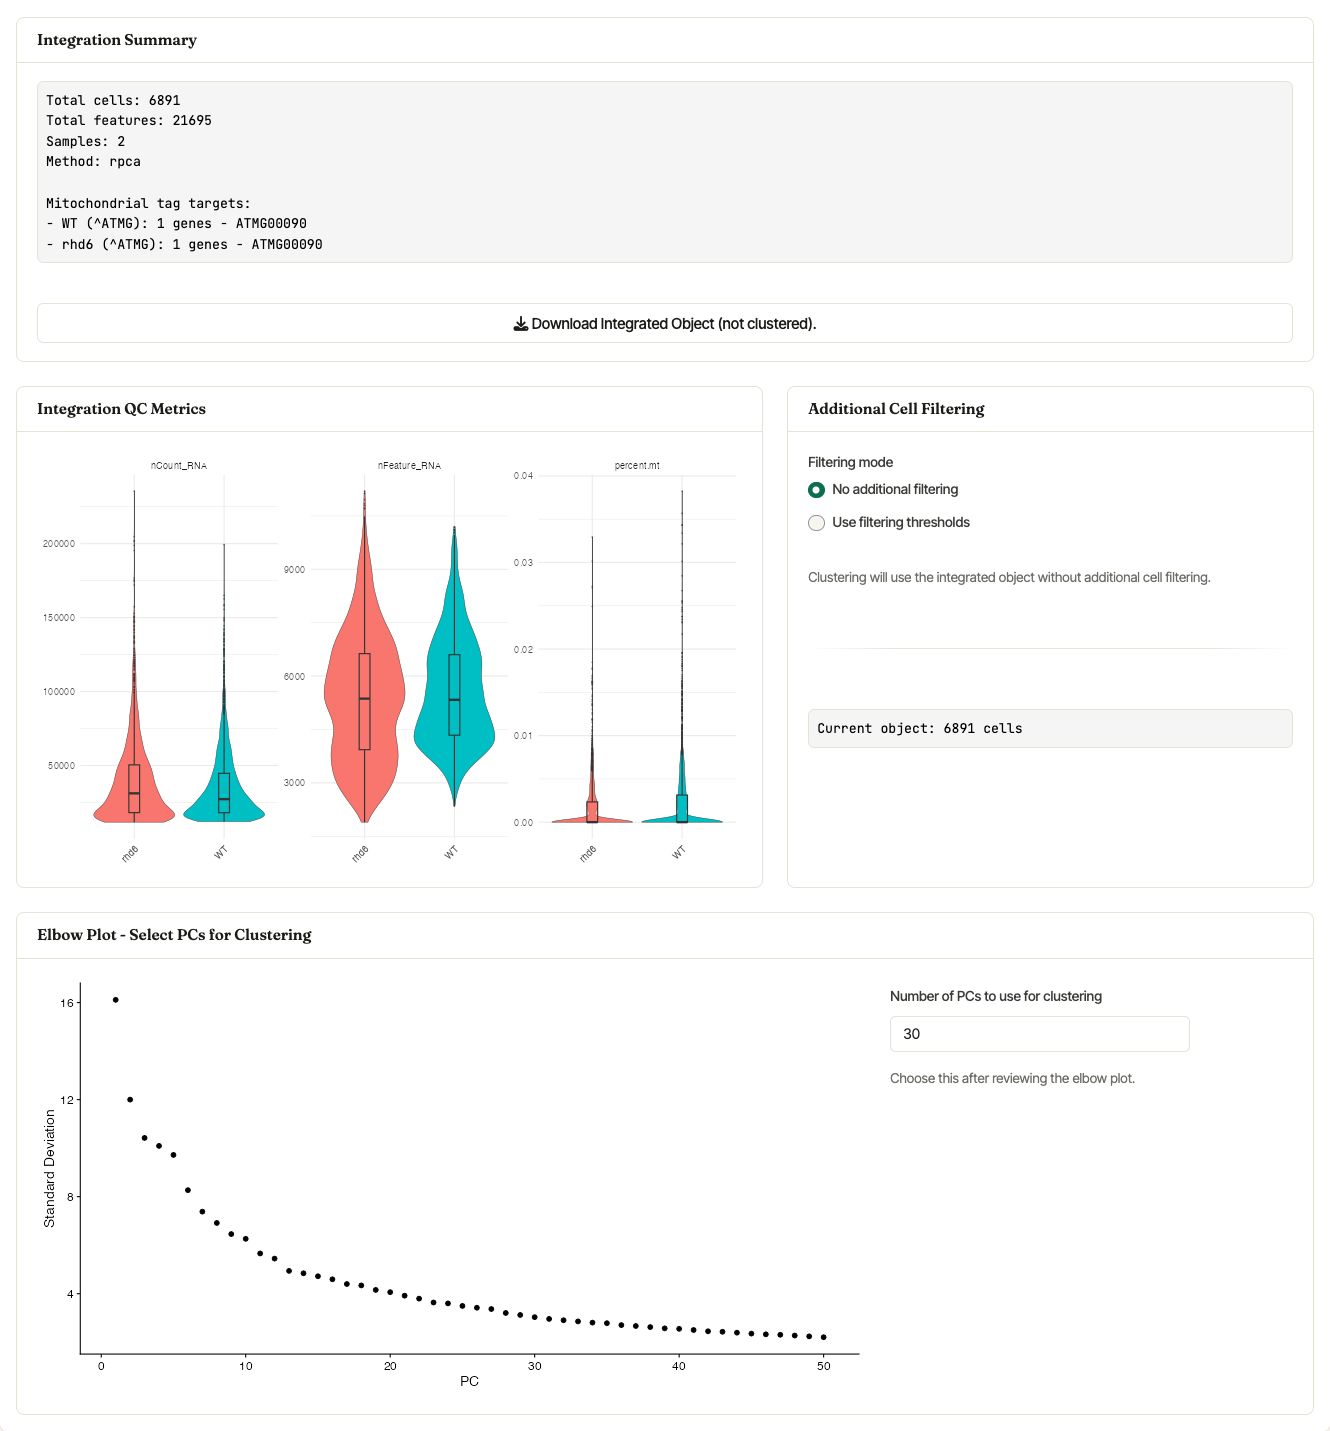
Integration summary, post-integration QC metrics, optional filtering, and the PC selector shown after RPCA integration of the WT and rhd6 example samples.
When SCTransform v2 is selected during integration, Asc-Seurat uses
the SCT assay through integration and clustering. For downstream
differential expression and expression visualization, Asc-Seurat also
prepares normalized RNA values so those modules can use the assay
recommended for marker testing and visualization.
Step 2: Clustering & Visualization
Set the Clustering resolution and click Run Clustering. The selected number of PCs comes from the Step 1 PC selector. Internally, Asc-Seurat uses Seurat’s FindNeighbors, FindClusters, and UMAP workflow on the integration reduction.
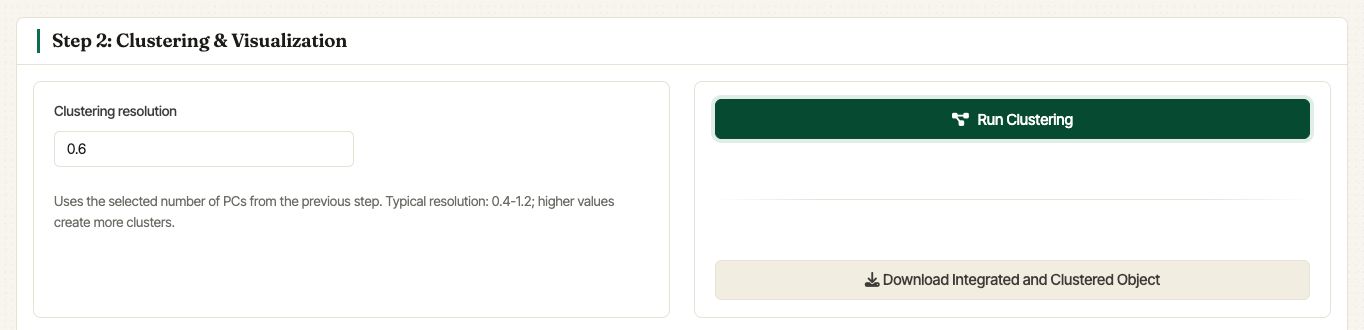
Step 2 controls for clustering the integrated object.
Resolution controls the number of clusters. Larger values generally split cells into more clusters; smaller values merge them into broader groups. There is no single optimal resolution, so compare a small set of values against expected marker genes and the biological question.
Integrated UMAP summaries
After clustering, Asc-Seurat displays the integrated UMAP colored by cluster and the same embedding colored by sample.
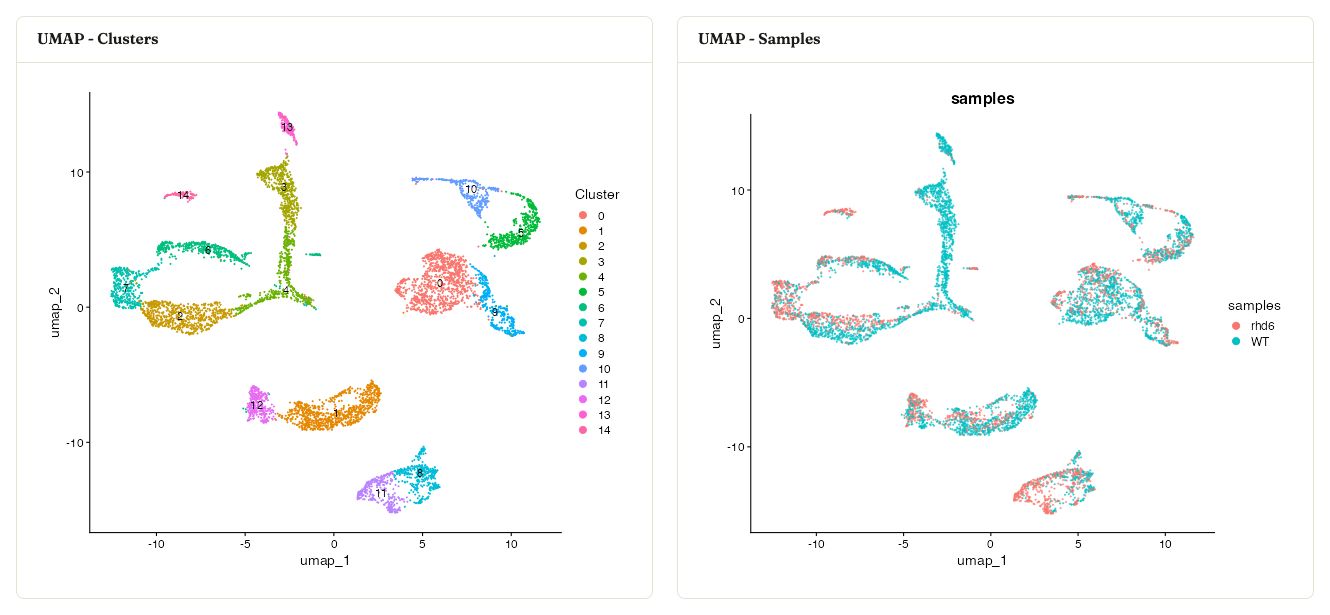
Integrated UMAPs from the WT and rhd6 example samples, colored by cluster and by sample.
The workflow also shows the cluster labels split by sample, which makes it easier to spot sample-specific cluster composition or uneven mixing.
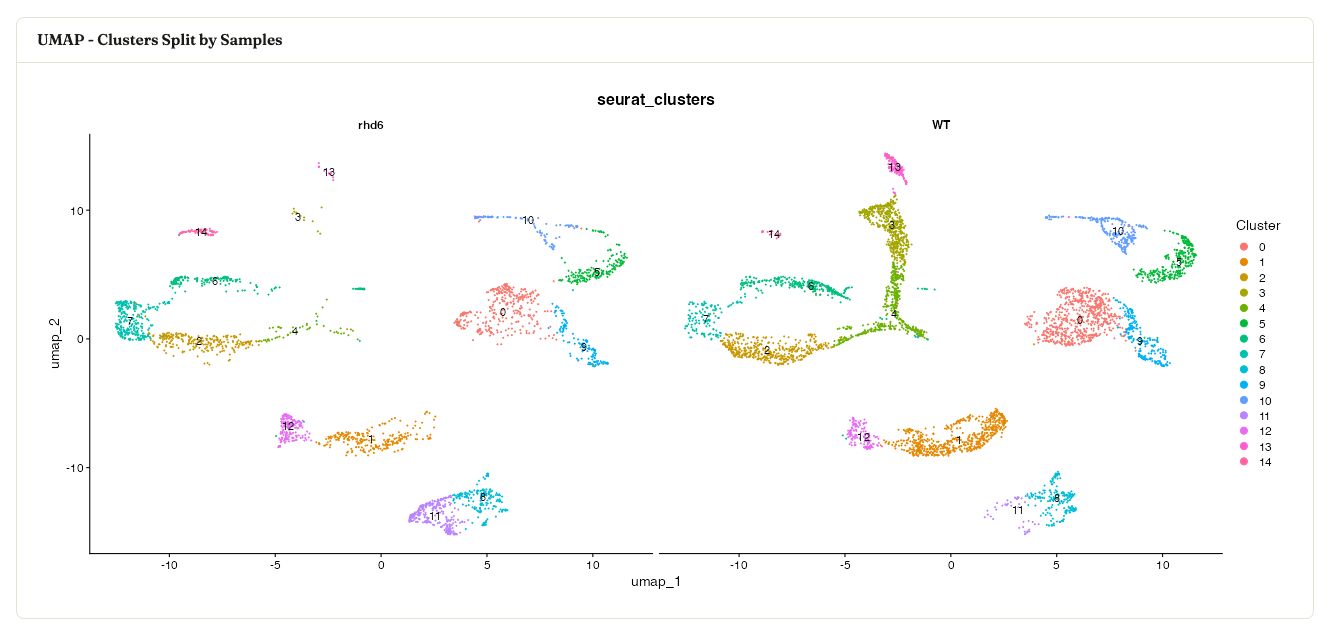
Integrated UMAP split by sample while retaining the cluster labels.
Cells per cluster and subsetting
Asc-Seurat reports the number of cells assigned to each cluster, broken down by sample. The Cluster Selection / Exclusion (optional) card can be used to keep or remove selected clusters before downstream analysis.
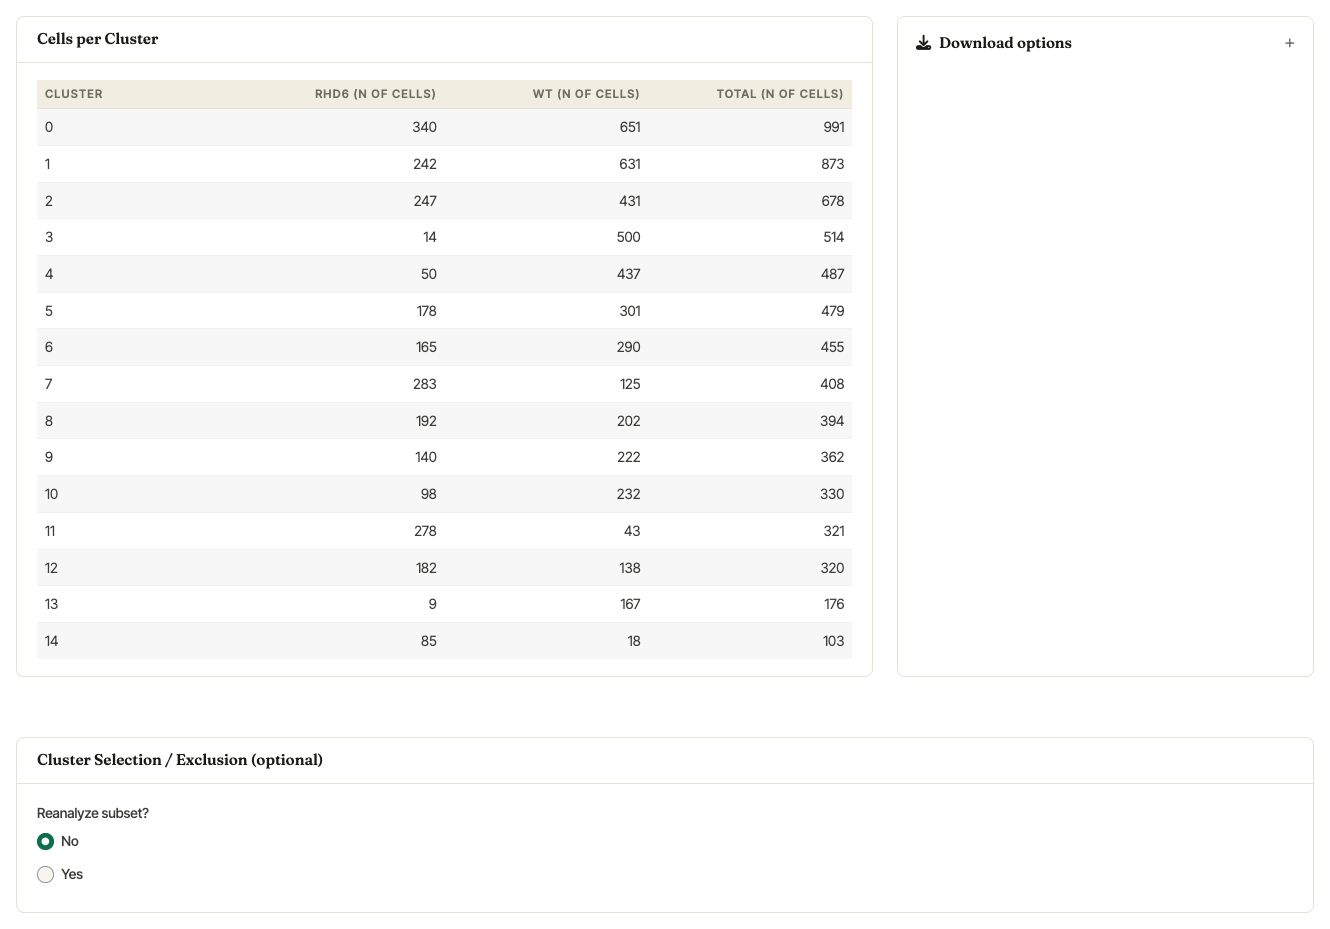
Cells per cluster table and the optional cluster selection / exclusion card.
When Recompute PCA and clusters is selected, Asc-Seurat creates a new subset object, recomputes normalization and PCA, and shows an updated elbow plot before clustering the subset again. When Keep current reduction and clusters is selected, the current embedding and cluster labels are carried forward for the selected subset.
Warning
Cluster numbering can change after selecting or excluding clusters, especially when PCA and clustering are recomputed for the subset.