Loading the data of an individual sample
The Single Sample tab reads 10X Genomics directories, 10X HDF5 files , CSV / TSV count matrices, AnnData files, and existing Seurat RDS files. Selecting an input type reveals the matching path or upload control.
Loading the data
To analyze an individual sample, select the Single Sample tab in the navigation bar. Step 1 of the tab — Load Data — handles the input.
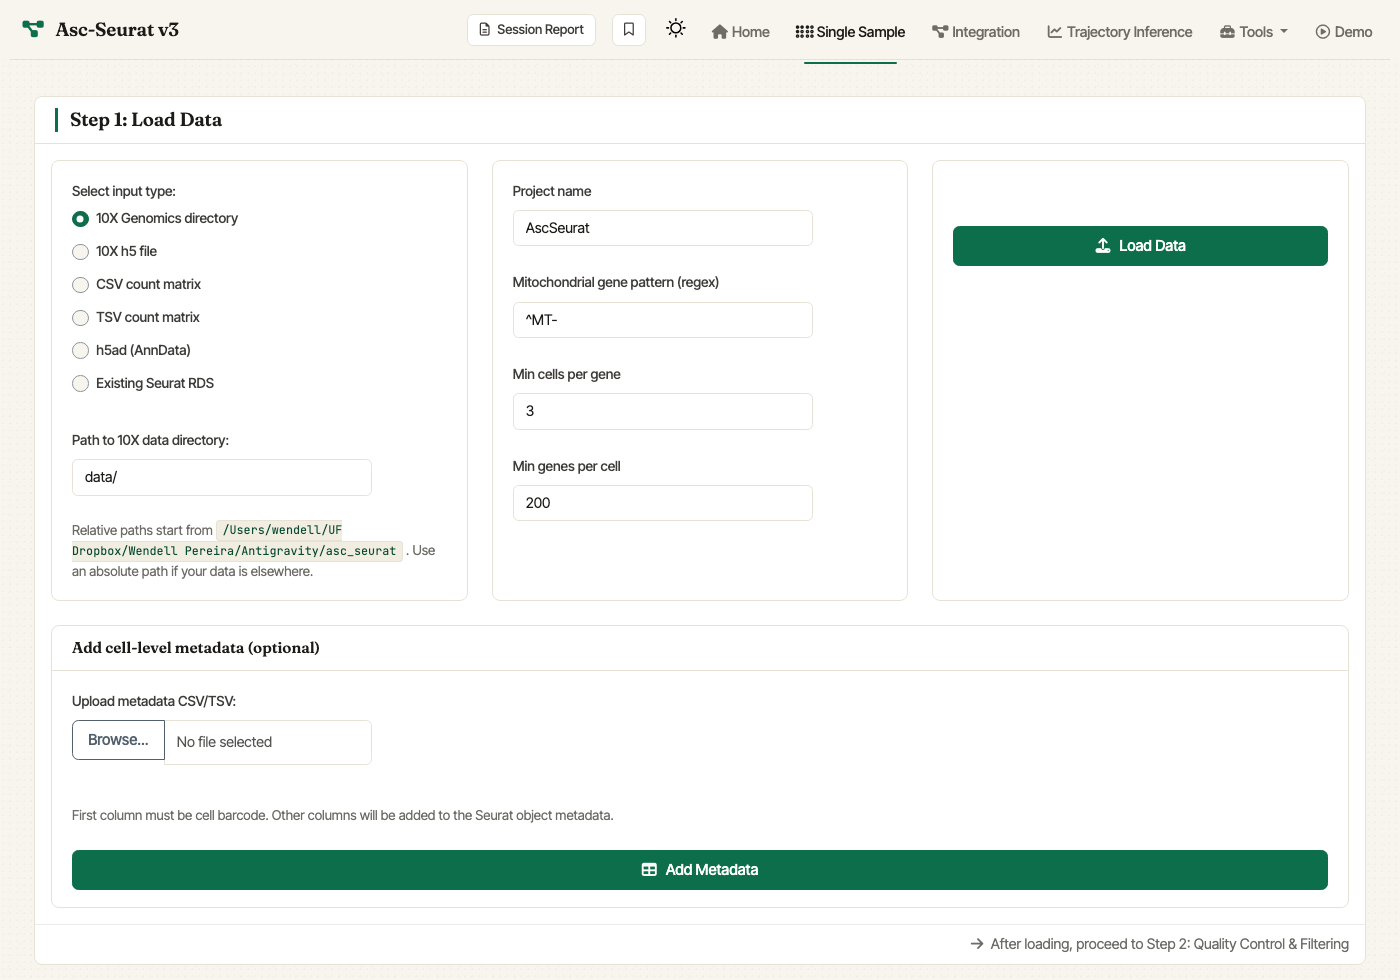
Single Sample — Step 1. Pick an input type, fill in the matching path or upload control, set the initial filtering parameters, and click Load Data.
The Load Data card has three columns:
Select input type (left column). Choose between:
10X Genomics directory— folder withmatrix.mtx.gz,barcodes.tsv.gz, andfeatures.tsv.gz. Reveals a Path to 10X data directory control.10X h5 file— single.h5file from Cell Ranger.CSV count matrix/TSV count matrix— comma- or tab-separated count matrix; first column is gene IDs, header is cell barcodes.h5ad (AnnData)— AnnData file; loaded throughanndataR.Existing Seurat RDS— resume from a Seurat object saved earlier. Older Seurat objects are upgraded automatically viaUpdateSeuratObject().
Initial parameters (middle column). These are passed to Seurat’s CreateSeuratObject and PercentageFeatureSet:
Project name: label used in some plots (default
AscSeurat).Mitochondrial gene pattern (regex): regular expression used to identify mitochondrial transcripts.
^MT-(default) works for human; use^mt-for mouse,^ATMGfor Arabidopsis, etc.Min cells per gene: include genes detected in at least this many cells (default
3).Min genes per cell: include cells expressing at least this many genes (default
200).
Path / upload + Load Data (right column). Relative paths in the path field are resolved against the working directory shown beneath the field; absolute paths work too when they are visible to the app process. In Docker, host paths such as
/Users/...must be bind-mounted first. The simplest Docker workflow is to launch the image from the directory where your data lives with-v "$PWD:/home/ascseurat/data:ro", then enter a path such asdata/sample/filtered_feature_bc_matrix. If the mounted folder is the 10X matrix directory, enterdata/. Alternatively, mounting-v "$HOME:$HOME:ro"lets macOS and Linux users paste normal paths under their home directory. Click Load Data to read the sample.
Optionally, the Add cell-level metadata card at the bottom of Step 1
lets you upload a CSV/TSV whose first column is the cell barcode; the
remaining columns are added to the Seurat object’s meta.data when
you click Add Metadata.
After loading, a violin plot of QC metrics appears in Step 2: Quality Control & Filtering, where you can set tighter thresholds before clustering. See quality control.